Economics Contest 7: Tax Game – 30 Hive Power to be won
Hi Everyone,
Welcome to the seventh Economics Contest for 2023. This month is the Tax Game. The Tax Game might be familiar to some of you. It was introduced in the 2022 Economics Challenge Series. See, the challenge from the Challenge Series 2022 to get a better idea of how it was played.
Welcome to the Tax Game
How to Play?
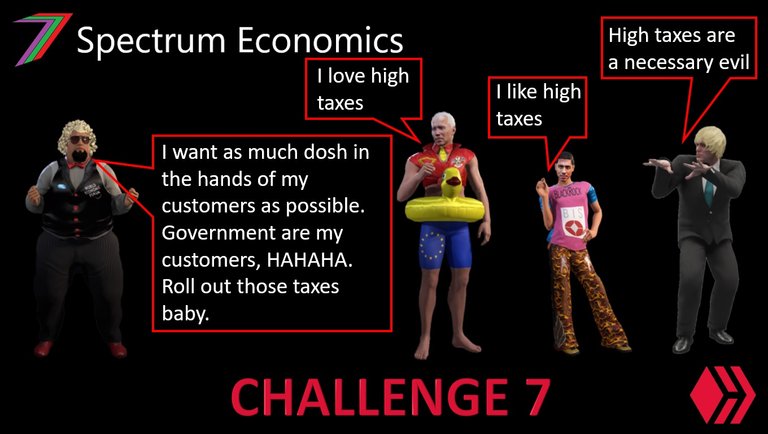
Taxation is a very divisive topic. Most people do not like paying taxes. Some people believe it is a necessary evil as many initiatives cannot or should not be funded by the private sector of the economy. Others believe that the Government are inefficient and incompetent and should not be trusted with large sums of money. Some people would even claim that Governments are corrupt and focused on serving their own needs with very little or no regard for the people they claim to represent. This contest requires participants to put their beliefs regarding tax to one side. Participants need to make decisions regarding tax rate based on what they believe will happen to income and welfare based on the parameters outlined in this contest.
For this contest, participants are required to set the tax rate for a very small country. Tax has been simplified to just a percentage of overall income (i.e. no distinction between different taxes such as income tax, corporate tax, GST, etc.). The current tax rate and national income are provided in the question. The participants are required to set the tax rate yearly for the next 3 years (i.e. rate in Year 1, Year 2, and Year 3). They can choose any tax rate they please (anywhere between 0% and 100%). Changing the tax rate will have both benefits and costs. For example, lowering the tax rate will raise income but, if tax revenue falls as a result of a lower tax rate, there could be a social cost of reduced funding of services provided by the Government. However, social costs will be reduced in the following year. It has been assumed the market will partially adjust to lower or higher Government spending.
The extent of the increase in income and changes in social cost will be determined in a Microsoft Excel model. The participants will be provided a range of possible values for parameters of key determinants of income and social cost.
All entries must be made in the comments section of this post.
Each account is only permitted one entry.
Objectives of the game
Participants should aim to maximise the sum of national income for the 3 years plus or minus changes in social costs during that same period. The participant that achieves this will win the contest.
Game Assumptions
- Reducing tax encourages economic activity and increasing tax discourages economic activity. The extent of the change in economic activity is determined through an algorithm (see formulae section).
- Reducing tax comes with an immediate cost. The extent of this cost is determined by the welfare penalty parameter outlined in the formulae section.
- The cost of reducing tax revenue is reduced over time as the economy adjusts to reduced Government expenditure. The extent of this adjustment is determine by the welfare recovery parameter (see formulae section).
- Increasing tax does not produce dollar for dollar benefits. It has been assumed the social benefits of a tax increase are equivalent to half the collected dollar value.
- Social benefits from tax increases are treated in the model as a negative social cost.
- Participants have no control over how tax revenue is used.
- Population is assumed to remain unchanged over the 3 years.
- Income, tax revenue, and welfare are assumed to be unaffected by anything beyond the information described in this contest.
What information is provided?
- Current National Income
- Current tax rate expressed as a percentage
- Current total tax revenue
- Range for sensitivity of income to tax rate
- Range for welfare recovery from tax shock
- Range for welfare penalty parameter from tax shock
Formulae
Below are formulae used to calculate income, tax revenue, and social cost for changes in tax rate.
New Income = Existing Income × (1 - New Tax RateX)/(1 - Existing Tax RateX)
New Tax Revenue = New Income × New Tax Rate
Benefit from Increased Tax Revenue = Increase in Tax Revenue/2
Welfare Penalty for Tax Revenue Reduction (YR1) = (2 + (ETR -TR(Yr1))/ETR)Y/2^Y
Welfare Penalty for Tax Revenue Reduction (YR2) = (2 + ( TR(Yr1) - TR(Yr2))/ TR(Yr1))Y/2^Y
Welfare Penalty for Tax Revenue Reduction (YR3) = (2 + ( TR(Yr2) - TR(Yr3))/ TR(Yr2))Y/2^Y
Social Cost (Yr1) = (ETR– TR(Yr1)) × WP(YR1)
Social Cost (Yr2) = 1/Z(ETR-TR(Yr1) × WP(YR1) + (TR(Yr2)-TR(Yr1)) × WP(YR2)
Social Cost (Yr3) = 1/Z2(ETR-TR(Yr1)) × WP(YR1) + 1/Z(TR(Yr2)-TR(Yr1)) × WP(YR2) + (TR(Yr3)-TR(Yr2)) × WP(YR3)
Net Outcome = New Income – Social Cost
Total = Net Outcome(YR1) + Net Outcome(YR2) + Net Outcome(YR3)
Where:
X = Parameter to determine sensitivity of income to tax rate. Value ranges between 1 and 1.5 (uniform distribution).
Y = Parameter to determine welfare penalty from reduced Government spending (Note: parameter excluded from tax rate increases). Value ranges between 3 and 6 (uniform distribution).
Z = Parameter for welfare recovery from changes in tax rate. Reduces impact based on the economy’s ability to adapt. Value ranges between 1 and 1.5 (uniform distribution).
ETR = Existing Tax Revenue
TR(YR) = Tax Revenue in respective year
WP(YR) = Welfare Penalty of tax revenue reduction in respective year
To gain a better understanding of the impact changing tax rate could have on income and tax revenue, see the Figures 1, 2, 3, and 4.
Figure 1: Income at different tax rates when parameter X = 1.5 (Maximum)
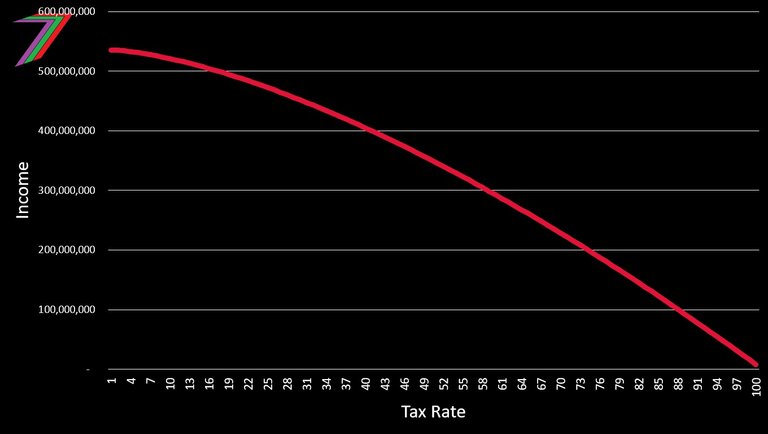
Figure 2: Income at different tax rates when parameter X = 1 (Minimum)
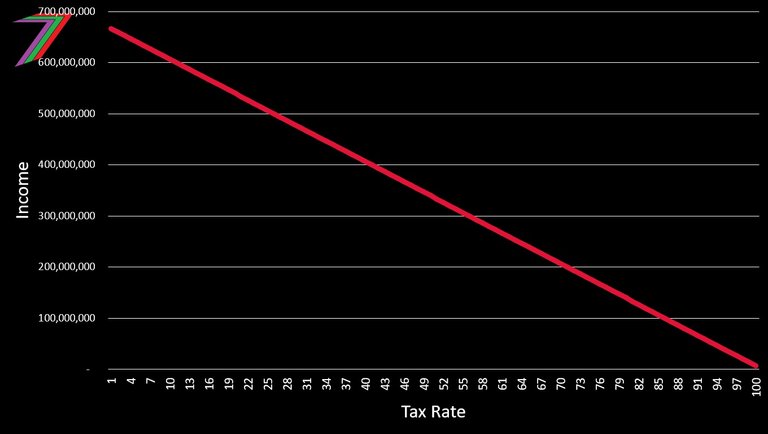
Figure 3: Relationship between Tax Revenue and Tax Rate when parameter X = 1.5 (Maximum)
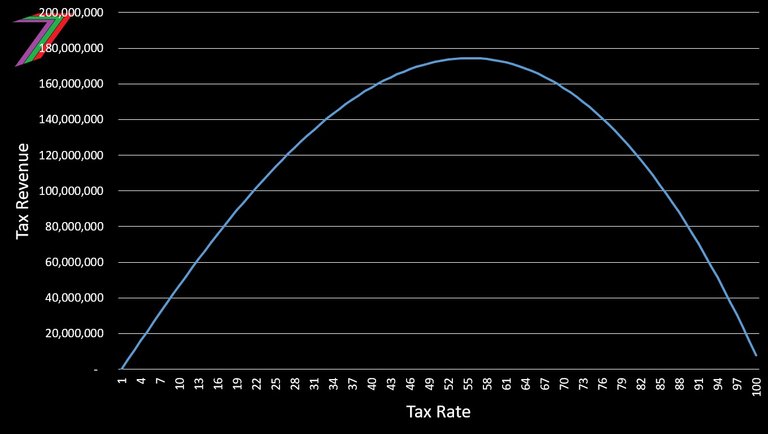
Figure 4: Relationship between Tax Revenue and Tax Rate when parameter X = 1 (Minimum)
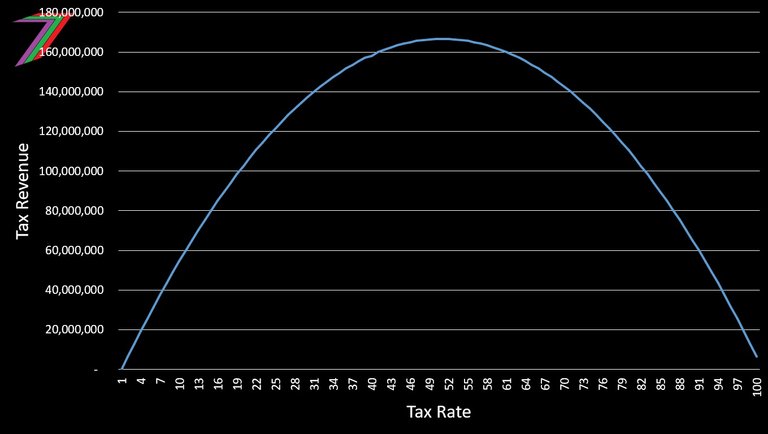
Note: Values on the y-axis are based on values provided later in the question.
To gain a better understanding of the impact the welfare penalty has on social costs see Figure 5.
Figure 5: The social cost parameter of reducing tax revenue when parameter Y = 3 and 6
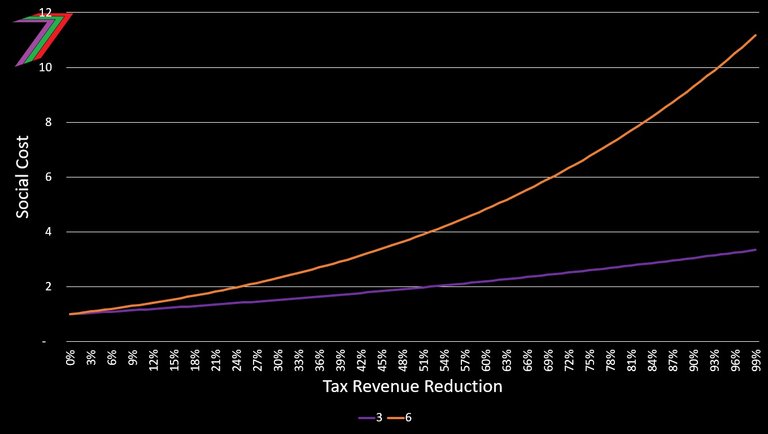
The welfare penalty increases as tax revenue falls. The parameter determines the extent of this increase. For example, if tax revenue is reduced by 100,000 and the parameter is 2, the social costs would be 200,000.
How are the results of the game determined?
A Microsoft Excel Model is used to determine the values of national incomes and social costs for each year. The model generates the values for the parameters for income sensitivity to tax rate, welfare penalty, and welfare recovery. The results post will contain a video of the generation of the values. The winner will be announced in both the video and written post.
Contest Prizes
The account with the winning entry will receive 30 Hive Power and the first 12 entries will be given upvotes. If two or more participants are tied, the first participant to enter wins. If no participants obtain a positive value from their winning bids, the 30 Hive Power is rolled over to next month’s contest.
Let the contest begin
Participants are required to enter tax rates for Year’s 1, 2, and 3. Information regarding the existing income, Government’s current tax rate, and tax revenue are shown in Table 1.
Table 1: Existing Income, Tax Rate, and Tax Revenue
| Item | Value |
|---|---|
| Tax Rate | 30% |
| Income | 447,477,020 |
| Tax Revenue | 134,234,106 |
| Social Cost | 0 |
| Net Outcome | 447,477,020 |
See the formulae section for the algorithms used to determine income, tax revenue, social costs/benefits, and net outcomes. The formulae section also contains the ranges for key parameters for these algorithms.
Entry format
For this challenge, I expect to see entries made in the following format:
Tax Rate Year 1:
Tax Rate Year 2:
Tax Rate Year 3:
Example of entry
Tax Rate Year 1: 27%
Tax Rate Year 2: 25%
Tax Rate Year 3: 25%
The closing date and time for this contest is 6PM coordinated universal time (UTC) 27/09/2023. Responses after this time will not be accepted. The winners will be announced in the results post along with the video containing the generation of values for each item.
I hope everyone has fun and enjoys the contest. I look forward to your participation in next month’s contest.
More posts

I have several collection of posts. I have organised these collections based on content and purpose.
The first collection contains six collection posts created before PeakD had the collection feature. Four of these posts relate to the core of my content, one of them contains all my Actifit Posts, and one of them contains my video course ‘Economics is Everyone’.

The second collection consists of the posts that I consider define my channel. These posts are significant in terms of content as well as how they contribute to the growth of the channel. These posts reveal the most about what I believe in.

The third and fourth collection is what I call my ‘Freedom-base Economics living book’. They contain all the posts that support my ideas about the value and power of freedom. Some of these posts explain what we can achieve with freedom and what we need to utilise it. Some of them explain how we are deprived of freedom and how we often give up freedom for security and comfort. The third collection concludes with possible scenarios depending on what we (society) choose to do.


Hive: Future of Social Media

Spectrumecons on the Hive blockchain

Tax Rate Year 1: 33%
Tax Rate Year 2: 52%
Tax Rate Year 3: 33%
Tax Rate Year 1: 28%
Tax Rate Year 2: 25%
Tax Rate Year 3: 22%
Interesting contest. Best of luck to all participants.
Tax Rate Year 1: 30%
Tax Rate Year 2: 25%
Tax Rate Year 3: 30%
Tax Rate Year 1: 30%
Tax Rate Year 2: 26%
Tax Rate Year 3: 22%
Tax Rate Year 1: 25%
Tax Rate Year 2: 35%
Tax Rate Year 3: 30%
Tax Rate Year 1: 26%
Tax Rate Year 2: 26%
Tax Rate Year 3: 32%
Tax Rate Year 1: 30%
Tax Rate Year 2: 35%
Tax Rate Year 3: 25%
Tax Rate Year 1: 25%
Tax Rate Year 2: 30%
Tax Rate Year 3: 35%
@tipu curate
Sorry, please curate posts not older than 1 day.